
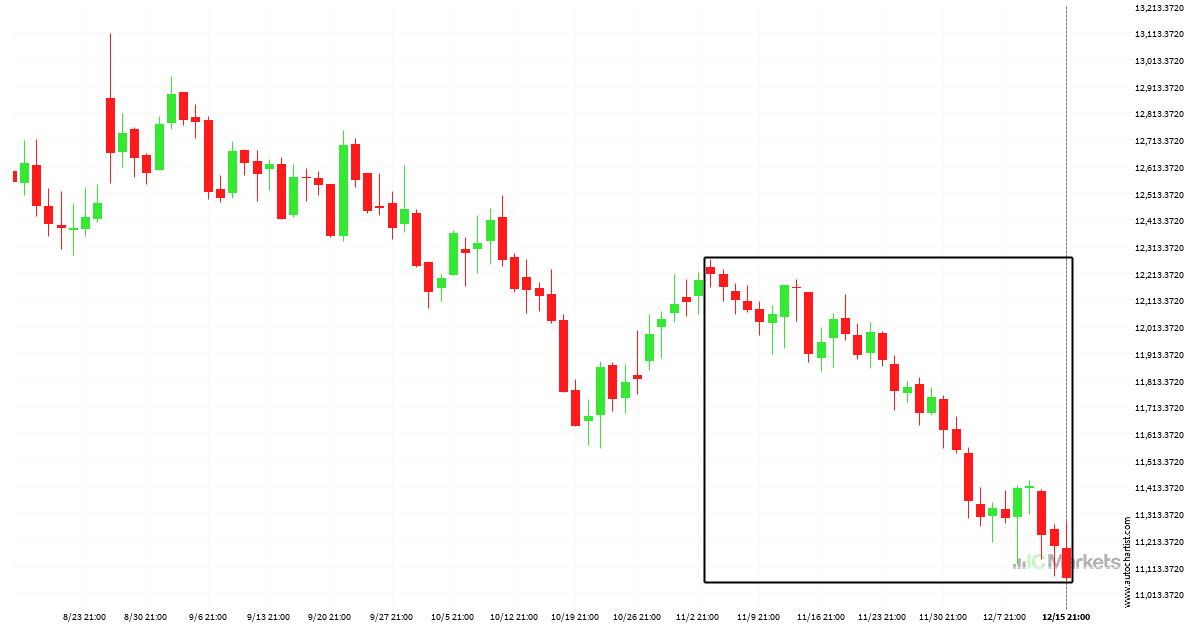
FTSE China A50 Index is on its way down
An unexpected large move has occurred on FTSE China A50 Index Daily chart beginning at 12208.43 and ending at 11069.43. Is this a sign of something new? What can we expect in the future?
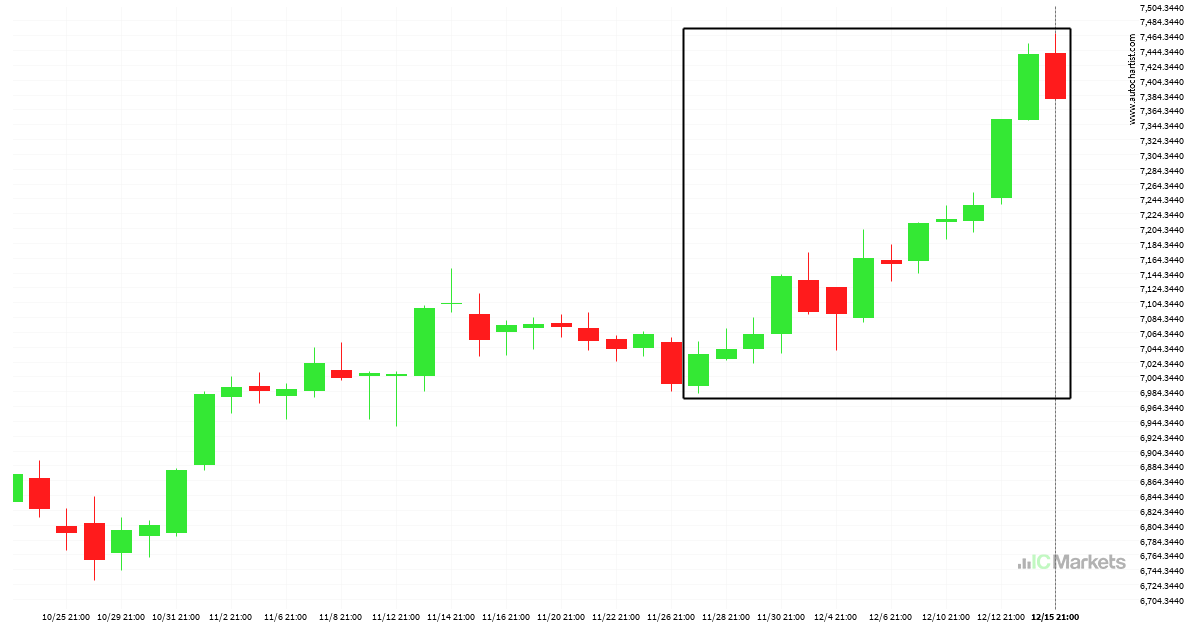
There was a bullish move on Australia 200 Index
Australia 200 Index has moved higher by 4.88% from 7034.85 to 7378.45 in the last 19 days.

Hong Kong 50 Index – Extreme movement, a rare opportunity
Those of you that are trend followers are probably eagerly watching Hong Kong 50 Index to see if its latest 3.25% move continues. If not, the mean-reversion people out there will be delighted with this exceptionally large 22 hours move.
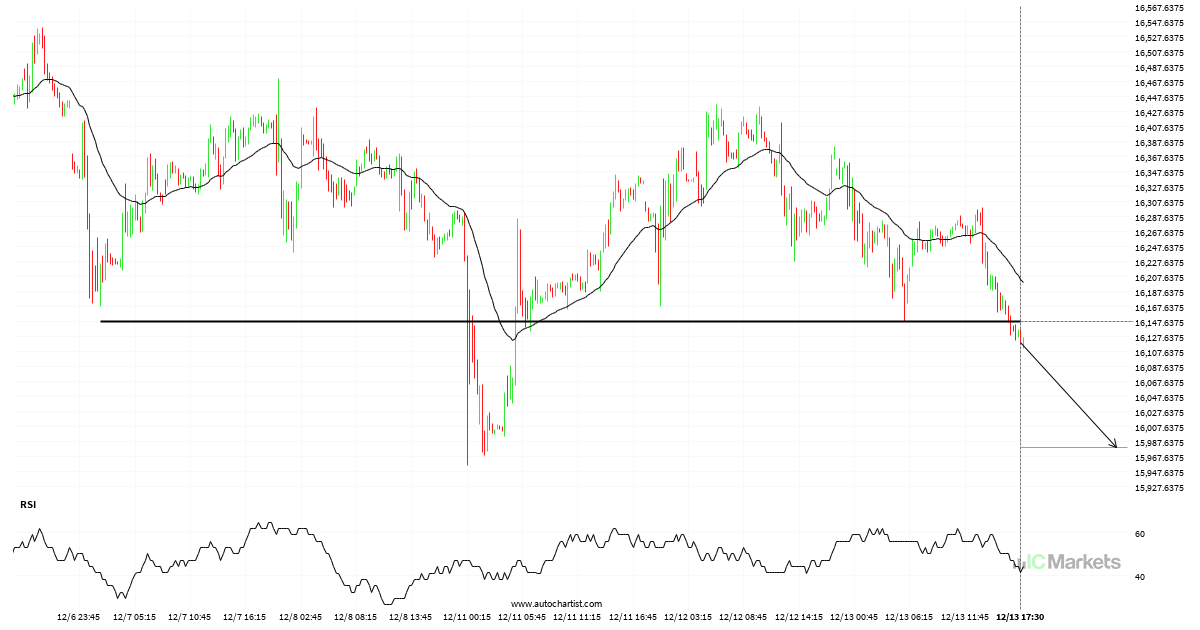
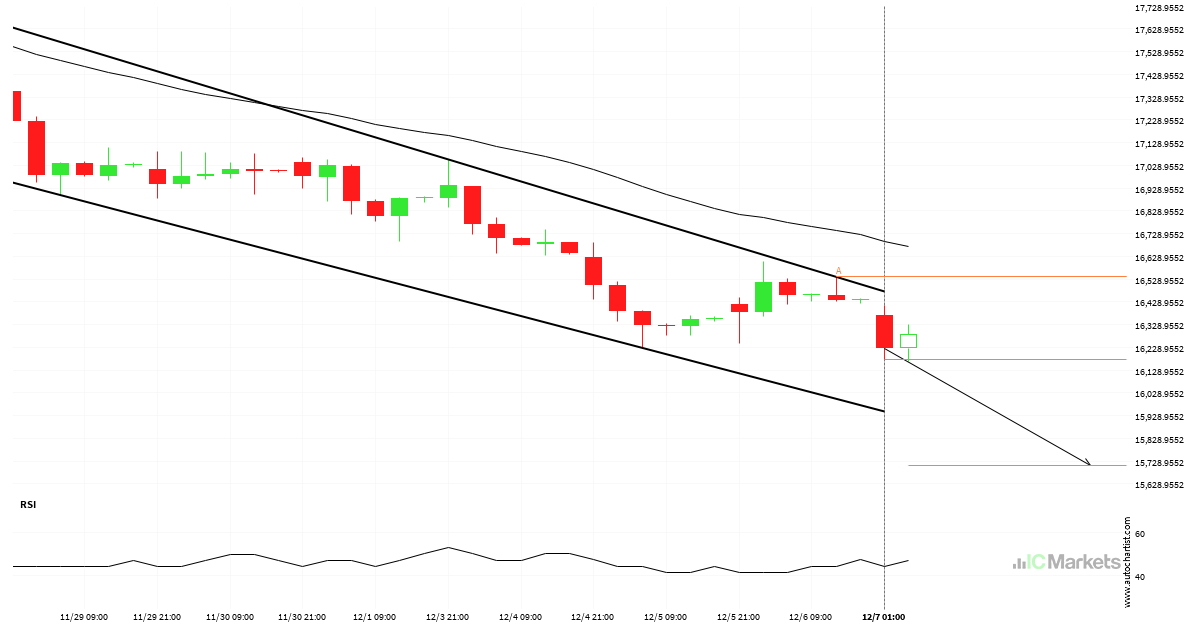
Hong Kong 50 Index breakout through support
Hong Kong 50 Index has broken through a support line. Because we have seen it retrace from this price in the past, one should wait for confirmation of the breakout before trading. It has touched this line numerous times in the last 7 days and suggests a possible target level to be around 15979.0996 within […]
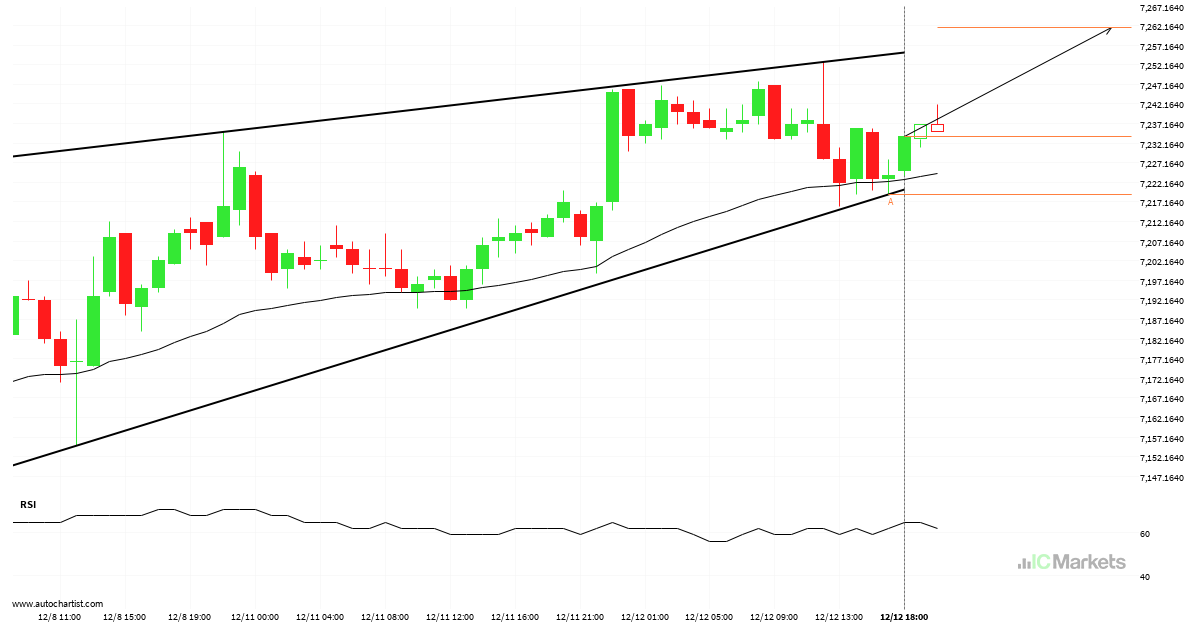
Possible breach of resistance level by Australia 200 Index
Australia 200 Index is moving towards a resistance line which it has tested numerous times in the past. We have seen it retrace from this line before, so at this stage it isn’t clear whether it will breach this line or rebound as it did before. If Australia 200 Index continues in its current trajectory, […]
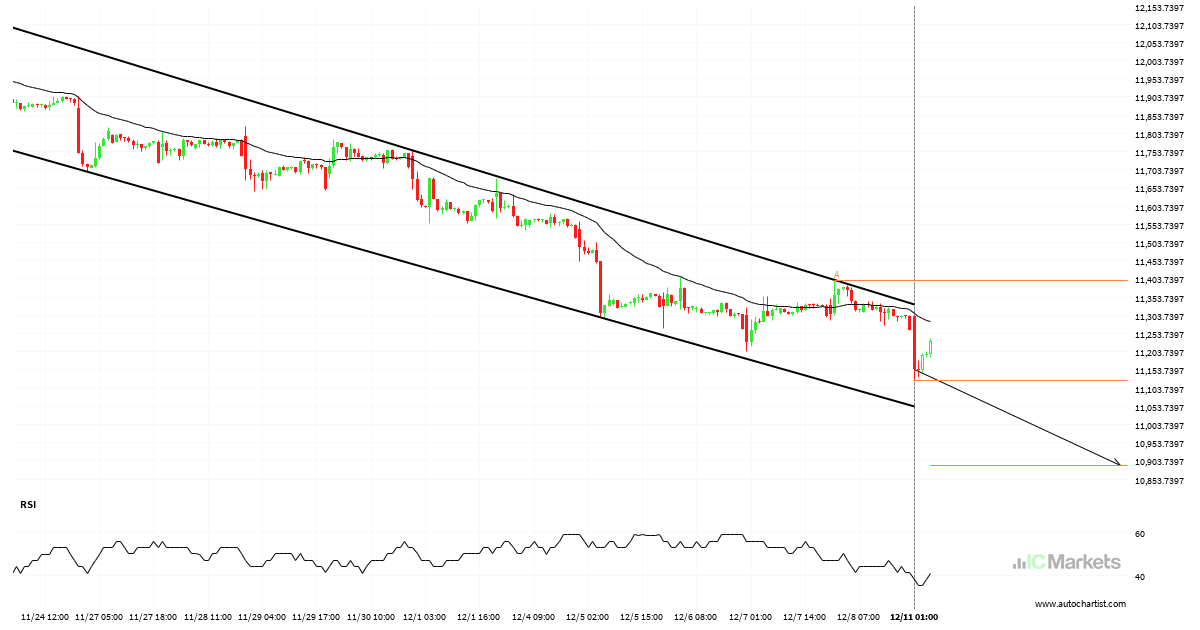
Either a rebound or a breakout imminent on FTSE China A50 Index
FTSE China A50 Index is moving towards a support line. Because we have seen it retrace from this line before, we could see either a break through this line, or a rebound back to current levels. It has touched this line numerous times in the last 18 days and may test it again within the […]
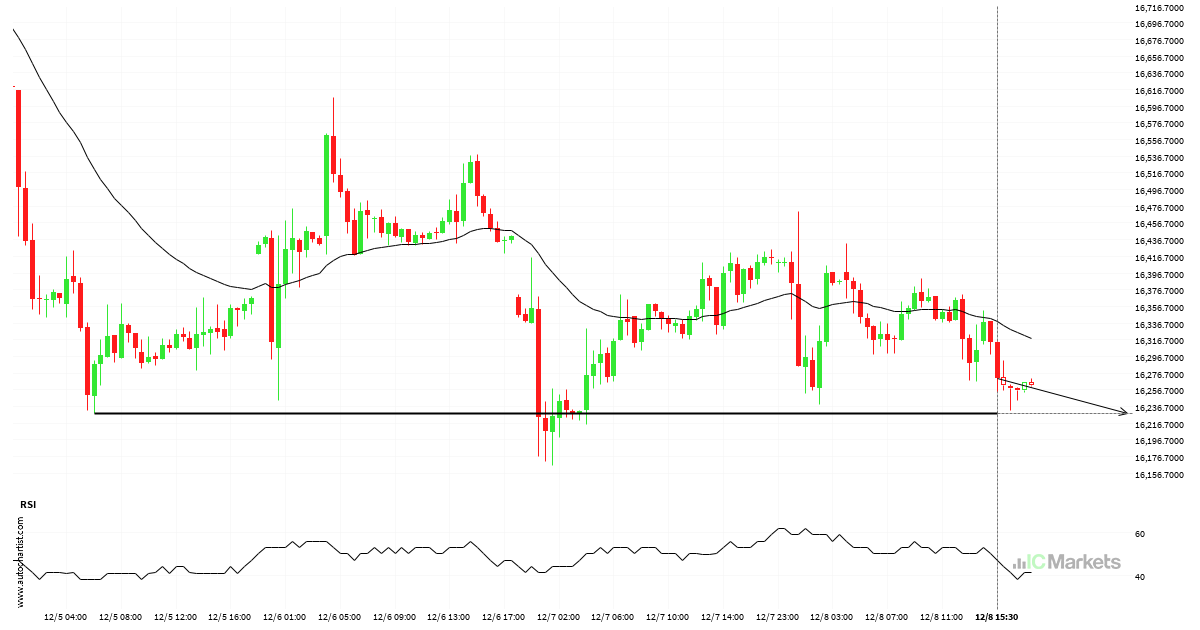
Hong Kong 50 Index is on the approach
Hong Kong 50 Index is moving towards a line of 16228.5000 which it has tested numerous times in the past. We have seen it retrace from this position in the past, so at this stage it isn’t clear whether it will breach this price or rebound as it did before. If Hong Kong 50 Index […]
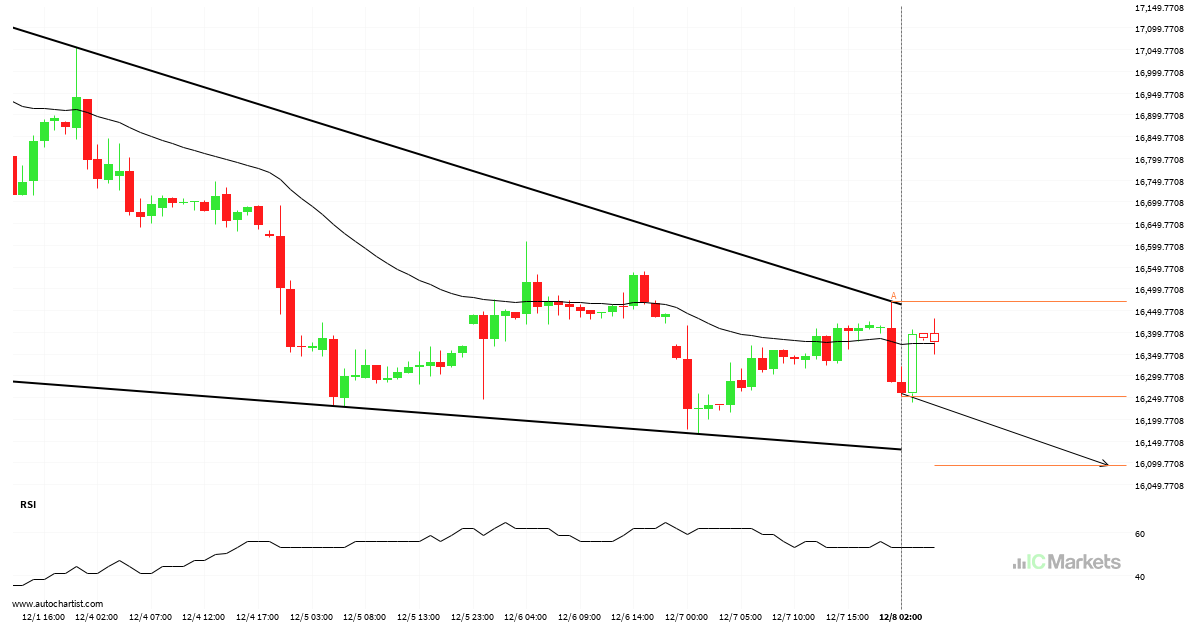
Hong Kong 50 Index – Reversal Chart Pattern – Falling Wedge
A Falling Wedge pattern was identified on Hong Kong 50 Index at 16252.5, creating an expectation that it may move to the support line at 16094.6364. It may break through that line and continue the bearish trend or it may reverse from that line.
Possible breach of support level by Hong Kong 50 Index
Hong Kong 50 Index is moving towards a support line. Because we have seen it retrace from this line before, we could see either a break through this line, or a rebound back to current levels. It has touched this line numerous times in the last 14 days and may test it again within the […]

Huge movement on FTSE China A50 Index, did you miss it?
FTSE China A50 Index has moved lower by 7.43% from 12208.43 to 11300.9 in the last 32 days.